Outlier Rejection
The sofia_redux.toolkit.stats.stats module incorporates outlier rejection in
several functions. Given a user defined threshold, sample \(i\) in
distribution \(x\) is defined as an outlier if:
\begin{eqnarray} & \frac{| x_{i} - median\{x\} |}{MAD} > threshold \\ & \text{where,} \\ & MAD = 1.482 \times median\{ | x_{i} - median\{x\} | \} \end{eqnarray}
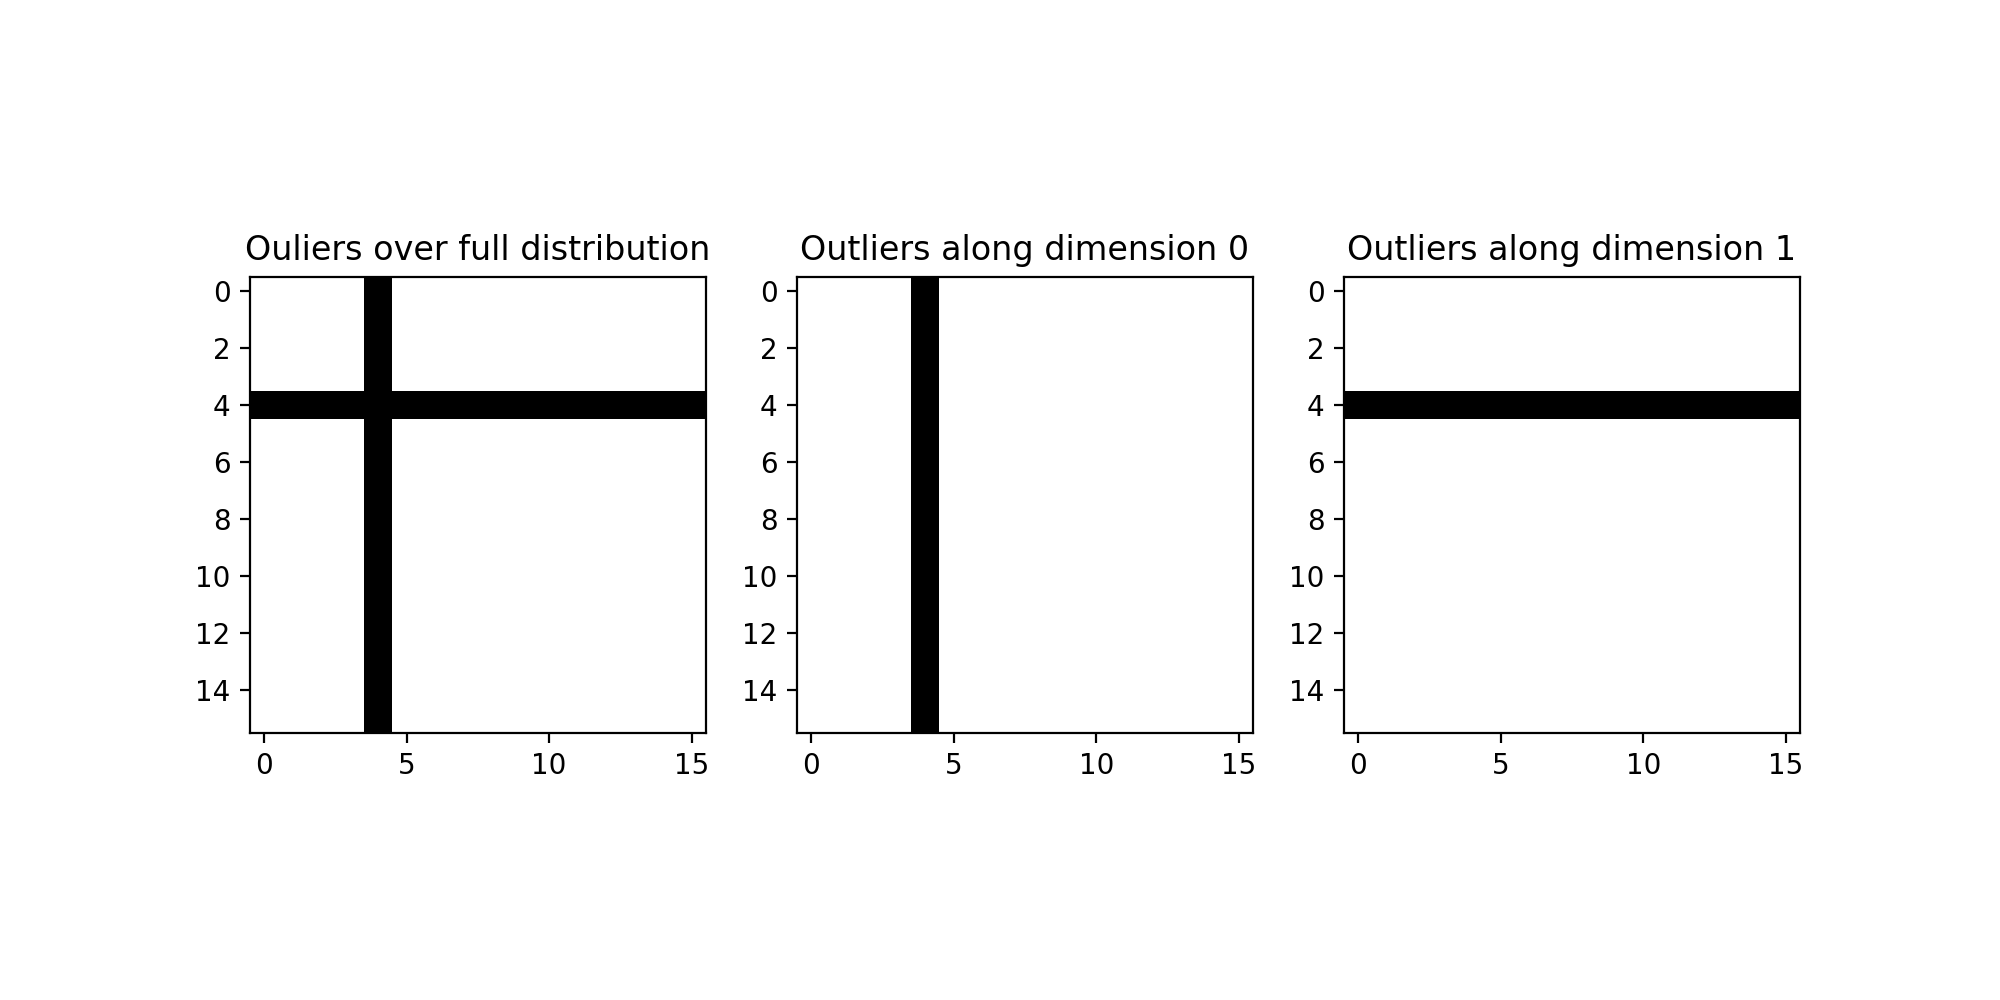
The find_outliers() function is used to identify outliers in a sample
distribution supplied as an N-dimensional array. The search may be applied
along a single dimension, or over the full set. Output supplied as a Boolean
mask with the same shape as the input array where False indicates an
outlier.
import numpy as np
import matplotlib.pyplot as plt
from sofia_redux.toolkit.stats import find_outliers

rand = np.random.RandomState(42)
x = rand.rand(16, 16) - 0.5
outliers = find_outliers(x, threshold=5)
assert outliers.all()  # Verify no outliers identified at this stage

# Insert a single bad row
x[4] += 100

# Insert a single bad column
x[:, 4] += 100

# Find outliers from the entire distribution, and along each dimension
full_outliers = find_outliers(x, threshold=5)
row_outliers = find_outliers(x, axis=0, threshold=5)
col_outliers = find_outliers(x, axis=1, threshold=5)

plt.figure(figsize=(10,5))
plt.subplot(131)
plt.imshow(full_outliers, cmap='gray')
plt.title("Ouliers over full distribution")
plt.subplot(132)
plt.imshow(row_outliers, cmap='gray')
plt.title("Outliers along dimension 0")
plt.subplot(133)
plt.imshow(col_outliers, cmap='gray')
plt.title("Outliers along dimension 1")
(Source code, png, hires.png, pdf)

Mean and Median Combination
The meancomb() function returns the weighted or straight mean of a
data array over the entire set or along an arbitrary dimension. Likewise,
the medcomb() function will return the median in the same fashion. If
provided, variance will be propagated accordingly. NaNs may either be
ignored and excluded (default) or propagated through all calculations.
from sofia_redux.toolkit.stats import meancomb, medcomb
import numpy as np

test_array = np.arange(16).reshape((4, 4)).astype(float)
variance = np.full_like(test_array, 1)

print(test_array)
# [[ 0.  1.  2.  3.]
# [ 4.  5.  6.  7.]
# [ 8.  9. 10. 11.]
# [12. 13. 14. 15.]]
print(meancomb(test_array, datavar=variance))
# (7.5, 0.0625)
print(medcomb(test_array, variance=variance))
# (7.5, 0.09817477042468103)
print(meancomb(test_array, datavar=variance, axis=0))
# (array([6., 7., 8., 9.]), array([0.25, 0.25, 0.25, 0.25]))
Statistics
The moments() function is used to provide statistics on a set of data,
optionally avoiding deviant data points as described in Outlier Rejection
above.
from sofia_redux.toolkit.stats import moments
import numpy as np

rand = np.random.RandomState(42)
data = rand.rand(100, 3)
data[50, 1] = 1e6  # insert a single spurious data value

stats = moments(data, axis=0)
stats.keys()
# dict_keys(['mask', 'mean', 'var', 'stddev', 'skewness', 'kurtosis'])
stats['mean']
# array([4.76849233e-01, 1.00005101e+04, 4.96303194e-01])
stats['stddev']
# array([2.85957102e-01, 9.99999485e+04, 2.88113989e-01])

# Repeat using outlier rejection
stats = moments(data, axis=0, threshold=5)
stats['mask'].sum()
# 299  # one sample has been masked out
stats['mean']
# array([0.47684923, 0.51521793, 0.49630319])
stats['stddev']
# array([0.2859571 , 0.31056431, 0.28811399])